If you’re from the Cisco world, no doubt you make regular use of the ‘sh cdp neighbor’ command to learn about how your network devices are physically connected – especially when learning about a new network with questionable documentation or physical labeling (though that never happens, right?).
Most network folks are also quite familiar with correlating mac address tables with ARP tables to DNS entries to find out exactly where end hosts are attached. But what if you have to approach the problem from another perspective? Said another way, how would someone at an end-host view the CDP data from an attached Cisco switch?
(I realize that many shops prefer to disable CDP on host-facing ports – especially those connected to equipment under the control of another entity. For the sake of this post, we’re going to suppose that CDP is enabled on the ports under discussion.)
We need to deconstruct CDP a bit (there is no magic, right?). CDP (as well as VTP) messages are sent in frames with an L2 multicast destination address of : 01-00-0c-cc-cc-cc. Depending on the options in your capture tool, you may be able to filter by the LLC protocol ID of CDP, which is 0x2000.
Knowing this, we just need to run a capture filtering for frames with that destination address. This can be done in various ways depending on your OS and the capture tool being used – below are a few examples.
Linux (running on a Raspberry Pi here)
tcpdump -nn -v -i eth0 -s 1500 -c 1 ‘ether host 01:00:0c:cc:cc:cc’
or
tcpdump -nn -v -i eth0 -s 1500 -c 1 ‘ether[20:2] == 0x2000’

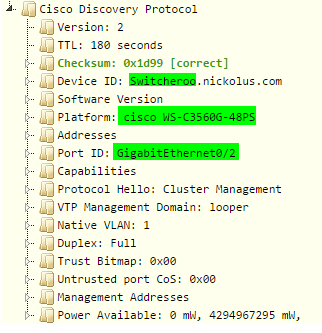
Wireshark (running on a Windows system in this example)
Start capture on the relevant interface, then enter ‘cdp’ in the filter field

CDP4Win
This is a handy tool for those who may not be comfortable with tcpdump or Wireshark, such as field techs who just need to quickly find port info.

ESXi
12/26/2016 edit:
While the method I presented below is valid, it’s a bit low-level. It turns out that there is native support in ESXi for viewing Cisco CDP info, as explained in the following VMware KB article: https://kb.vmware.com/selfservice/microsites/search.do?language=en_US&cmd=displayKC&externalId=1007069
Original Entry Follows…
This gets a little trickier, as there isn’t an easy way to display the output of a capture at the ESXi CLI (or I just haven’t figured it out – will freely admit that I am a relative beginner in the ways of VMware).
- SSH to the ESXi host (you may need to enable ssh for the host if it isn’t already enabled)
- To save output to a file (in pcap format):
- [root@localhost:/tmp] pktcap-uw –uplink vmnic0 –mac 01:00:0c:cc:cc:cc -o /tmp/cdptrace.pcap
- Then transfer the file to whatever system / tool you like to use to read pcaps
- [root@localhost:/tmp] pktcap-uw –uplink vmnic0 –mac 01:00:0c:cc:cc:cc -o /tmp/cdptrace.pcap
- To display output on screen (will be in hex) use the following command:
- [root@localhost:/tmp] pktcap-uw –uplink vmnic0 –mac 01:00:0c:cc:cc:cc
0x0000: 0100 0ccc cccc 0019 aab0 af02 01ce aaaa
0x0010: 0300 000c 2000 02b4 1d99 0001 001b 5377
0x0020: 6974 6368 6572 6f6f 2e6e 6963 6b6f 6c75
0x0030: 732e 636f 6d00 0500 fc43 6973 636f 2049
0x0040: 4f53 2053 6f66 7477 6172 652c 2043 3335
0x0050: 3630 2053 6f66 7477 6172 6520 2843 3335
0x0060: 3630 2d49 5053 4552 5649 4345 534b 392d
0x0070: 4d29 2c20 5665 7273 696f 6e20 3132 2e32
0x0080: 2835 3529 5345 3130 2c20 5245 4c45 4153
0x0090: 4520 534f 4654 5741 5245 2028 6663 3229
0x00a0: 0a54 6563 686e 6963 616c 2053 7570 706f
0x00b0: 7274 3a20 6874 7470 3a2f 2f77 7777 2e63
0x00c0: 6973 636f 2e63 6f6d 2f74 6563 6873 7570
0x00d0: 706f 7274 0a43 6f70 7972 6967 6874 2028
0x00e0: 6329 2031 3938 362d 3230 3135 2062 7920
0x00f0: 4369 7363 6f20 5379 7374 656d 732c 2049
0x0100: 6e63 2e0a 436f 6d70 696c 6564 2057 6564
0x0110: 2031 312d 4665 622d 3135 2031 313a 3334
0x0120: 2062 7920 7072 6f64 5f72 656c 5f74 6561
0x0130: 6d00 0600 1863 6973 636f 2057 532d 4333
0x0140: 3536 3047 2d34 3850 5300 0200 1100 0000
0x0150: 0101 01cc 0004 c0a8 0102 0003 0016 4769
0x0160: 6761 6269 7445 7468 6572 6e65 7430 2f32
0x0170: 0004 0008 0000 0028 0008 0024 0000 0c01
0x0180: 1200 0000 00ff ffff ff01 0221 ff00 0000
0x0190: 0000 0000 19aa b0af 00ff 0000 0009 000a
0x01a0: 6c6f 6f70 6572 000a 0006 0001 000b 0005
0x01b0: 0100 1200 0500 0013 0005 0000 1600 1100
0x01c0: 0000 0101 01cc 0004 c0a8 0102 001a 0010
0x01d0: 0000 0001 0000 0000 ffff ffff
- [root@localhost:/tmp] pktcap-uw –uplink vmnic0 –mac 01:00:0c:cc:cc:cc
- Converting Hex to ASCII:
- If someone knows how to cleanly display the output of the capture at the ESXi CLI just like can be done with tcpdump, please share!
Palo Alto Firewall
This example only pulls data from the FW mgmt interface, but a similar procedure is possible from data plane ports…though it goes without saying that care should be used when taking packet captures in any production environment.
# let capture run for about 30 seconds
tcpdump snaplen 1500 filter ‘ether[20:2] == 0x2000’
# view pcap on screen
view-pcap verbose++ yes mgmt-pcap mgmt.pcap
# or alternately, tftp it somewhere
That’s about it! I hope this comes in handy for folks.
Background
Shout-out to Derek Parsons, one of my old colleagues, who had the idea to run the tcpdump command from Redhat Linux devices while we were doing a network migration. Saved us a ton of time!
CDP4Win – found this tool during a quick Google search when some field support colleagues said that a Fluke test device was way too expensive and they needed a cheap, easy way to pull CDP info using only a laptop.
Palo Alto method – referenced Palo Alto support documentation for packet captures and just plugged in the filters that worked in Linux.
ESXi CLI method – figured it out by referencing VMware documentation and combining the methods that had already worked on other platforms.
References:
https://en.wikipedia.org/wiki/Cisco_Discovery_Protocol
https://wiki.wireshark.org/CDP
https://sourceforge.net/projects/cdp4win/files/cdp4win/
https://www.wireshark.org/docs/dfref/c/cdp.html
https://kb.vmware.com/selfservice/microsites/search.do?language=en_US&cmd=displayKC&externalId=2051814
